Electro-State
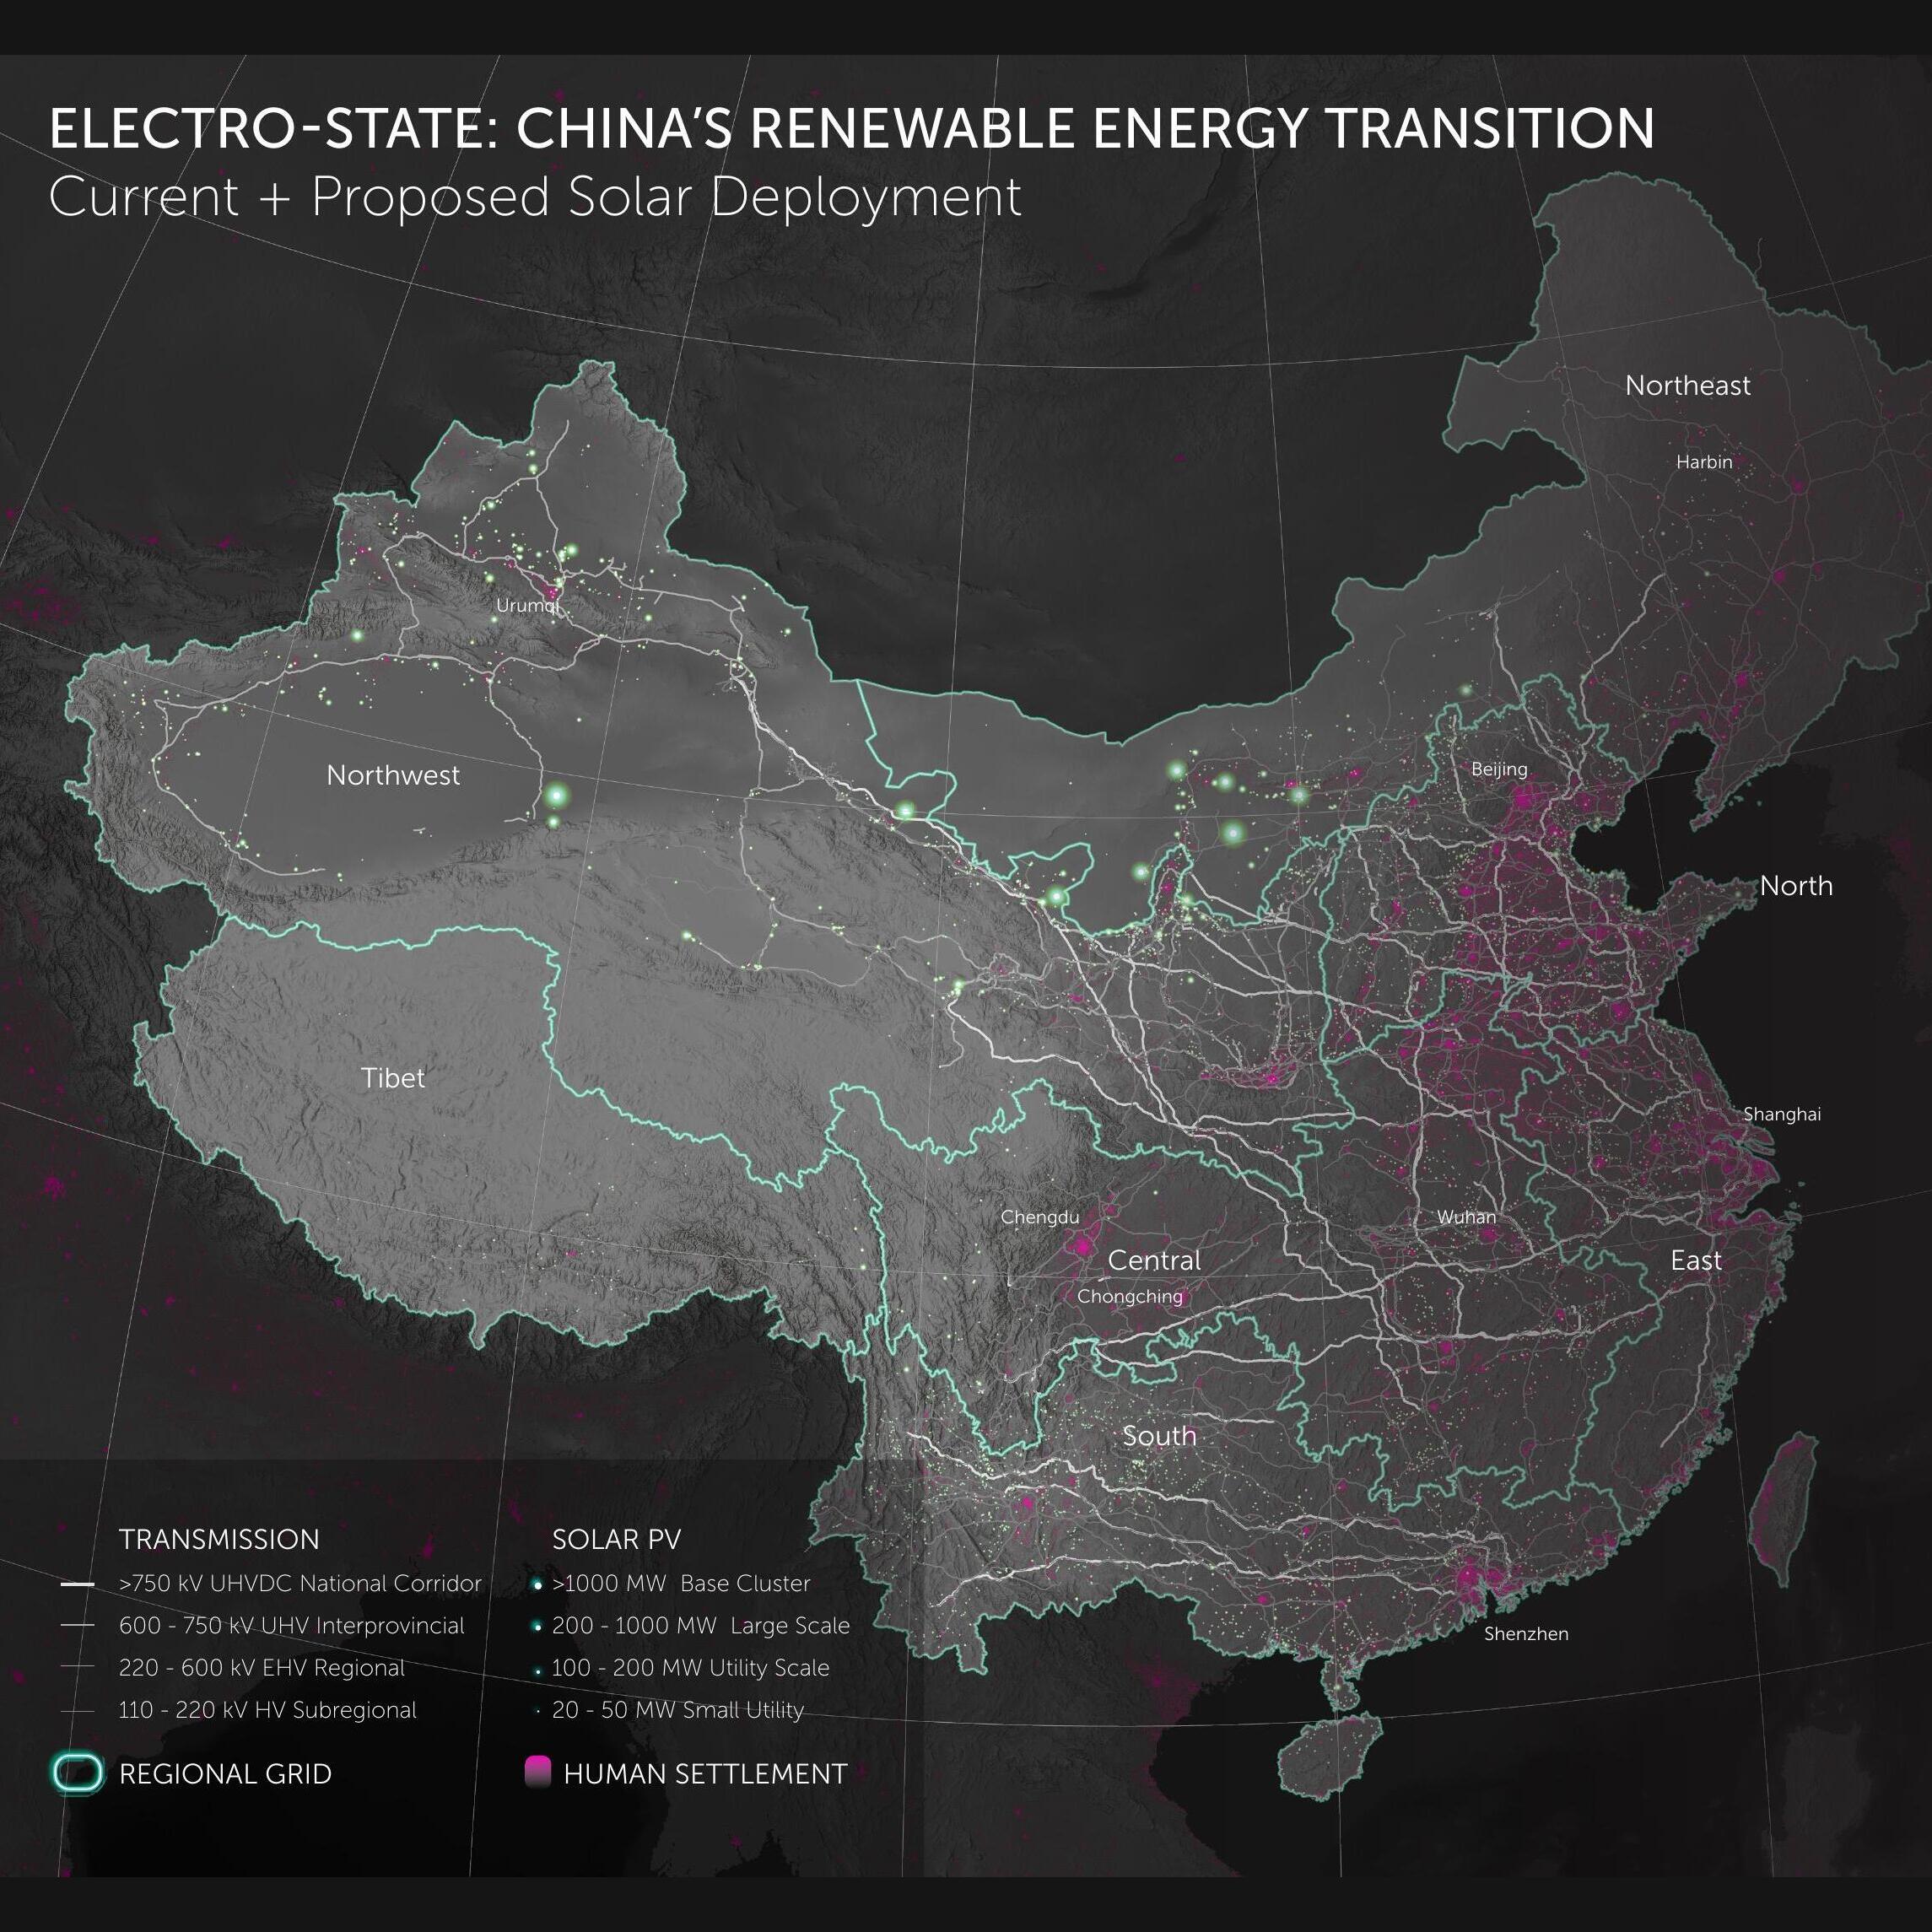
China leads the world in clean-energy deployment, but its transition is defined as much by geography as by scale: generation concentrates in resource-rich, remote regions while demand sits on the coast. This project maps the magnitude and spatial distribution of that transformation — generation assets and the transmission required to move power to load — with an emphasis on solar.
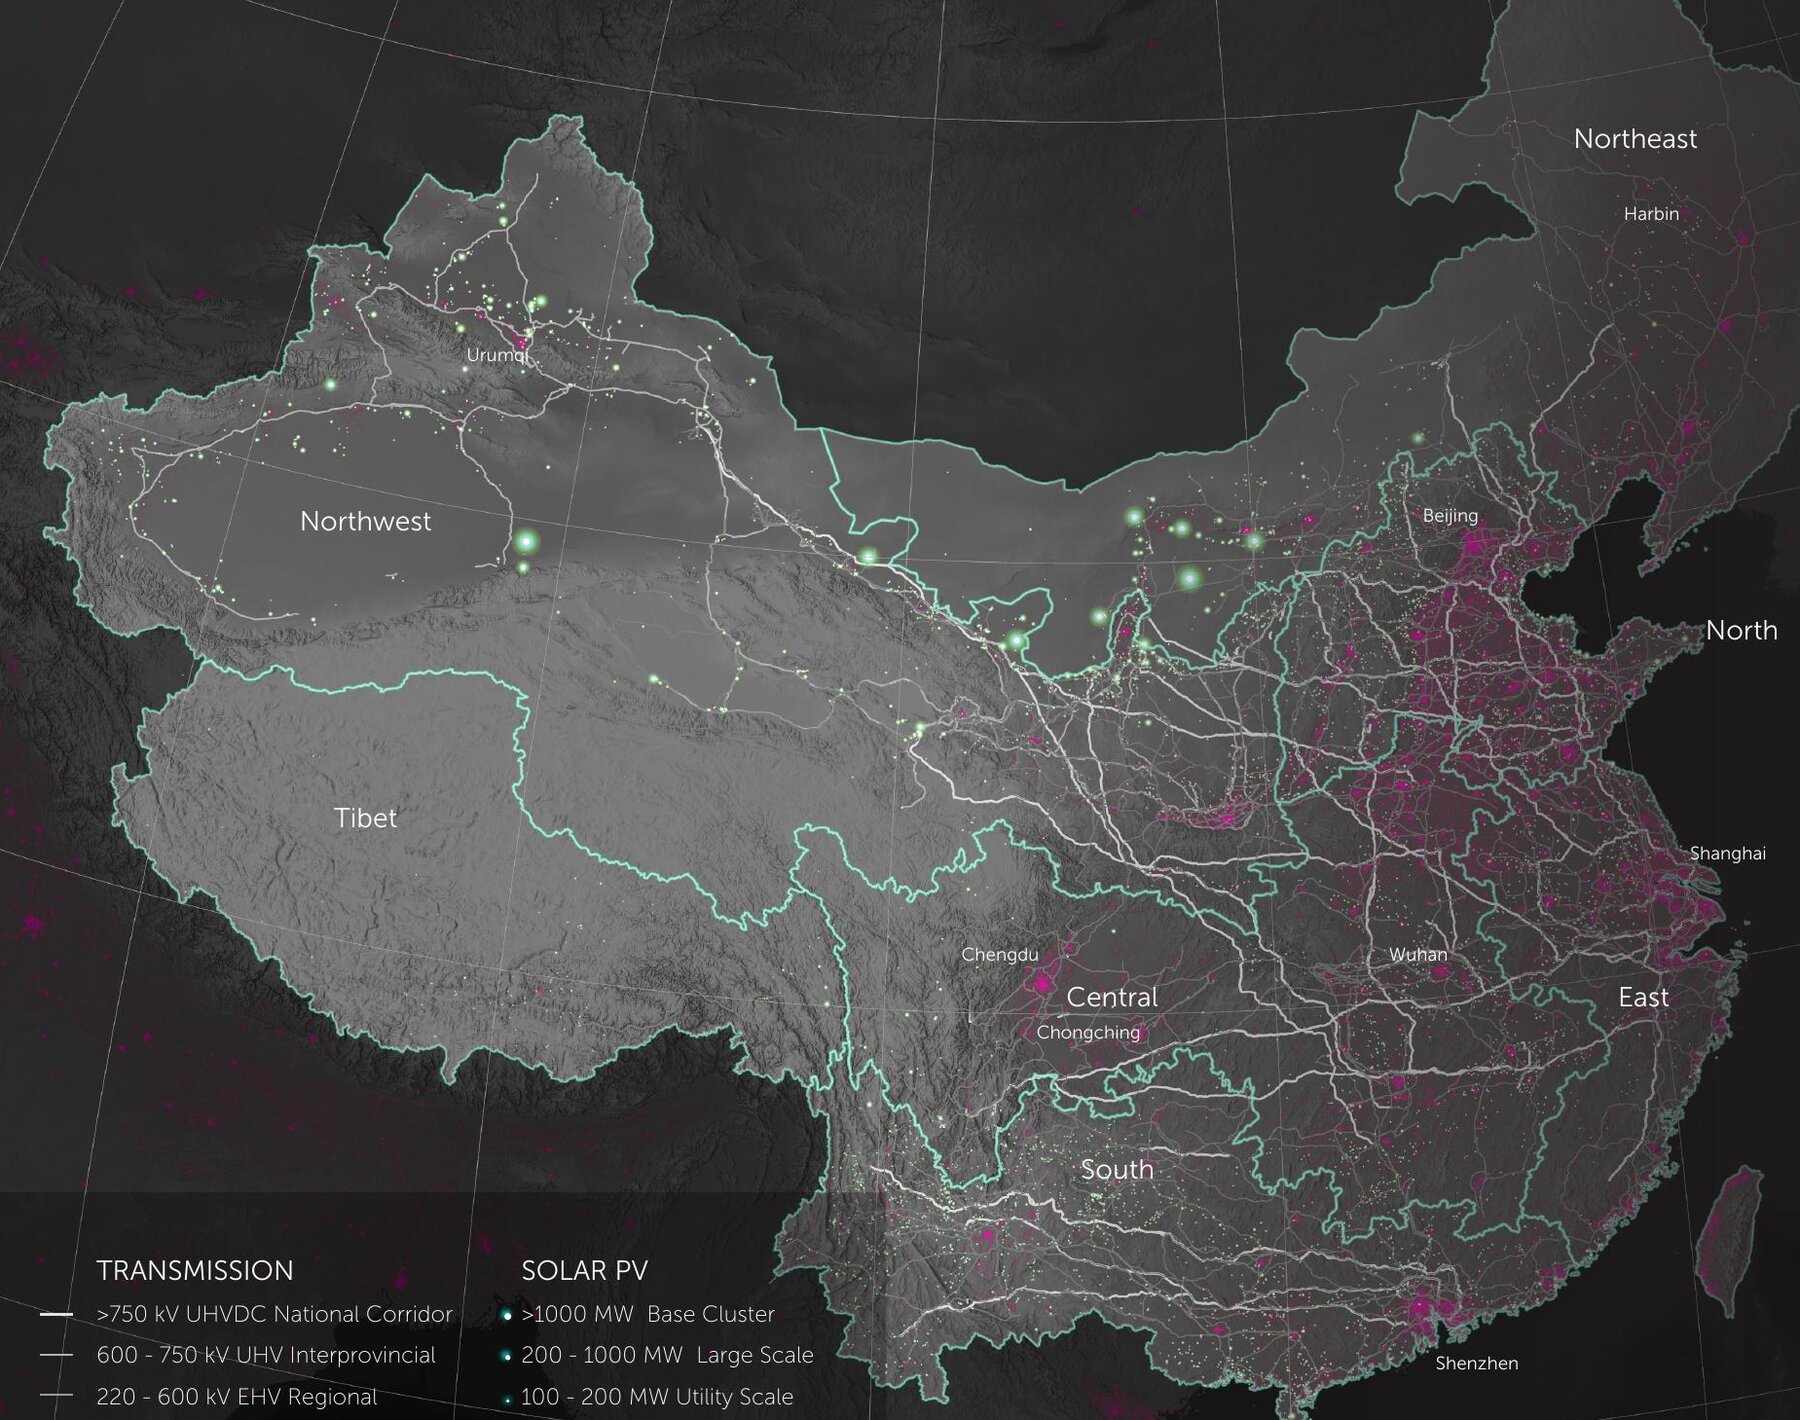
A mapping-based spatial analysis of generation and transmission infrastructure across China. Generation was mapped by source, project scale, and location; transmission by voltage class and orientation — integrating Global Energy Monitor's renewable and gigawatt-scale mega-base trackers, U.S. EIA grid data, and OpenStreetMap transmission networks.
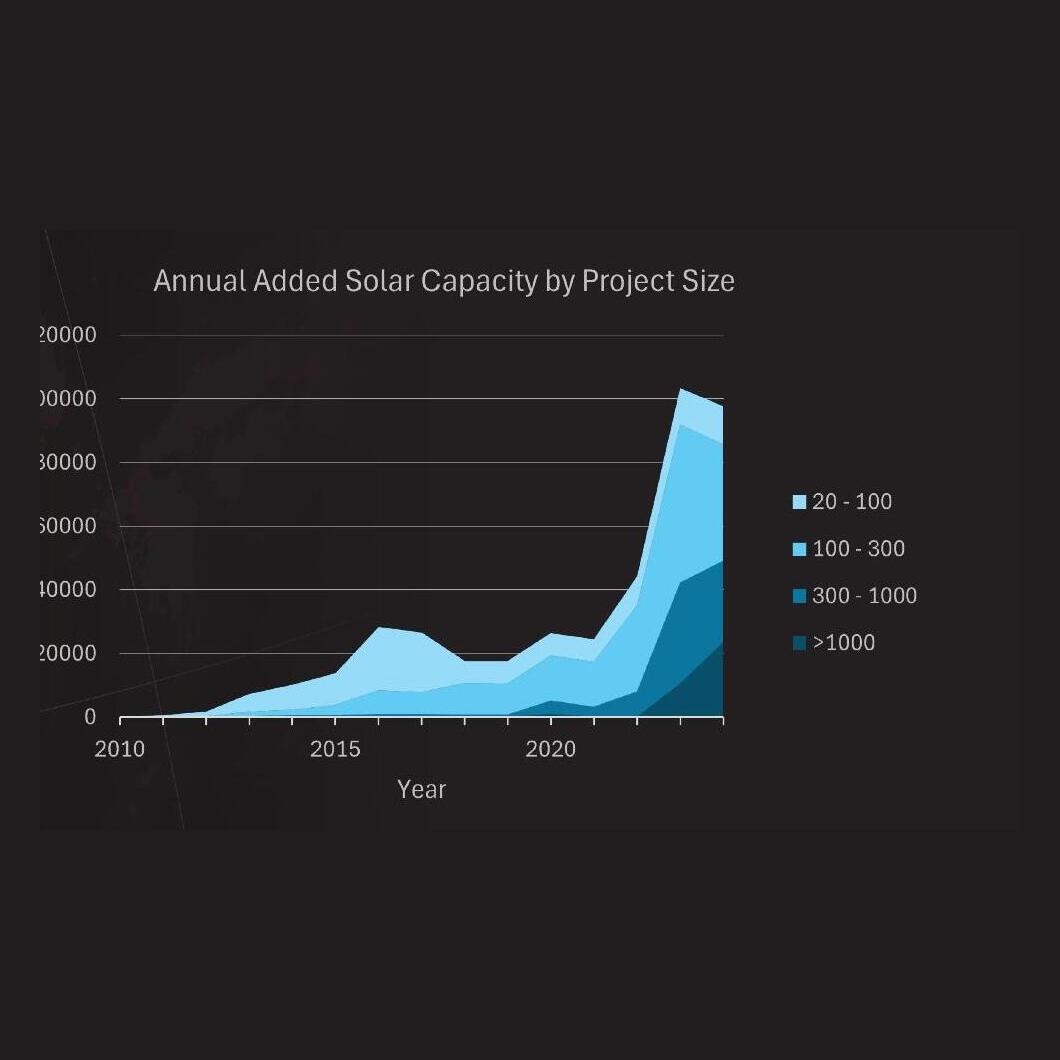
- Solar is now China's dominant renewable — over 2× wind capacity — with an inflection around 2021 and 2023 additions roughly 500% above pre-2020 levels.
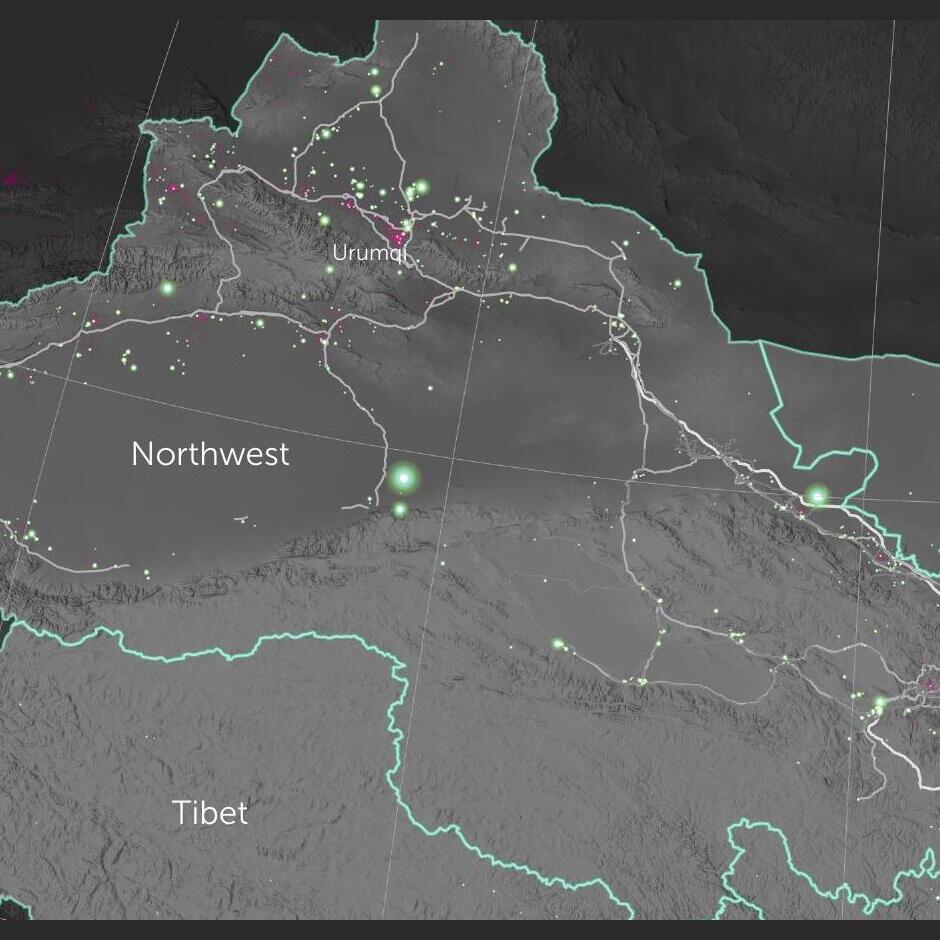
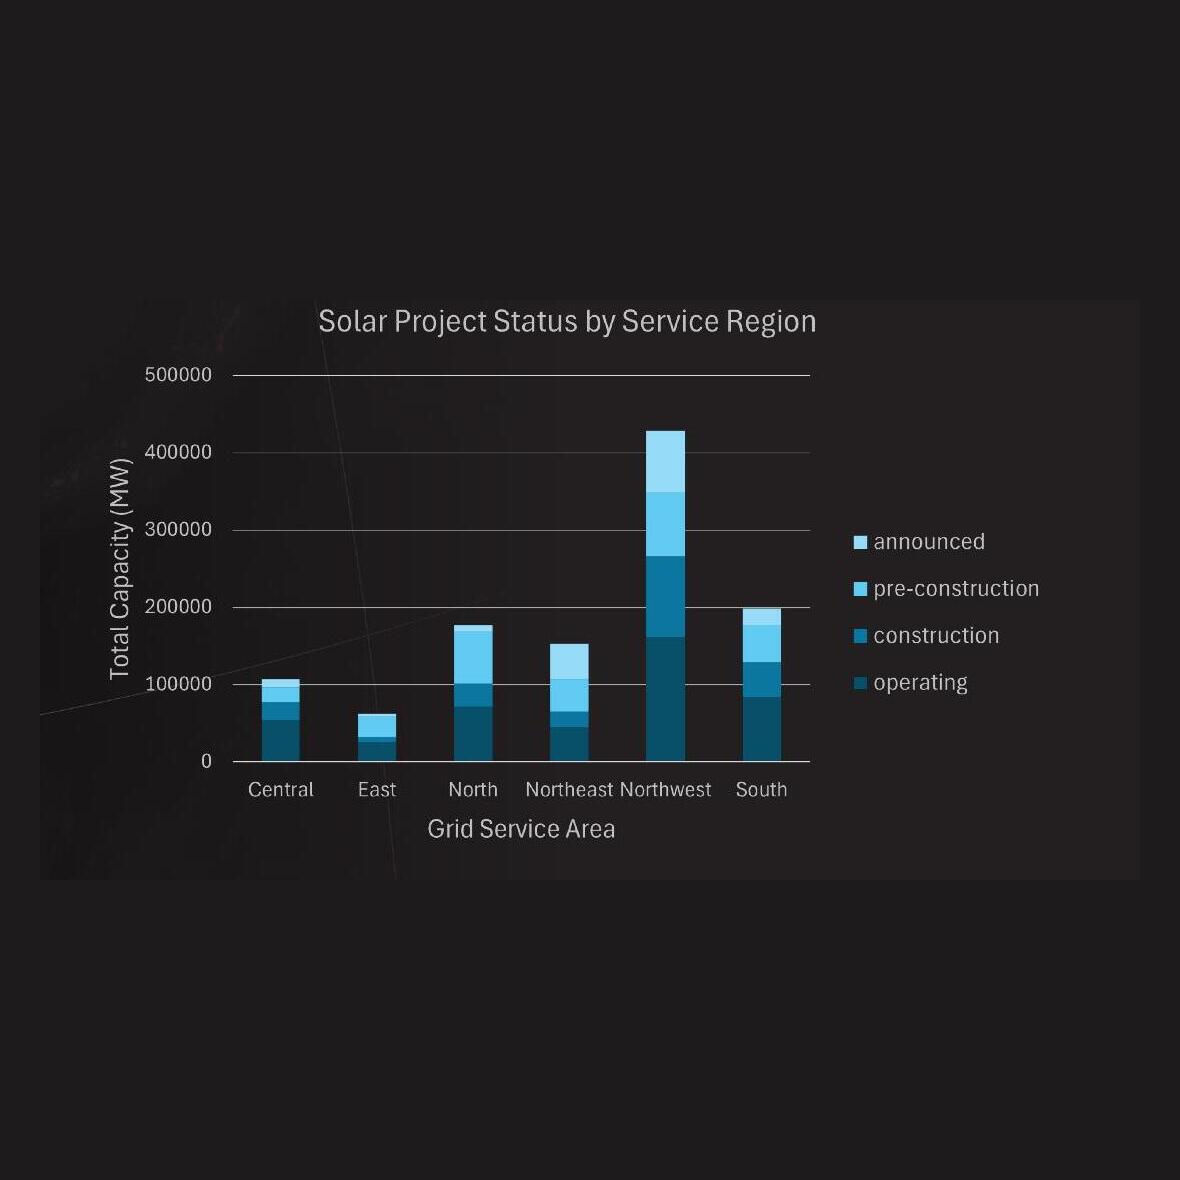
- Development concentrates in the northwest, where cheap land and high irradiance draw data centers and industry to co-locate.
- Power moves east on a UHVDC backbone (750–1000 kV) fed by ~600 kV interprovincial lines.
- Capacity factors near 15% and curtailment above 6% make transmission and storage the binding constraints.
China's buildout shows the energy transition's binding constraint in advance: generation concentrates far from load, so transmission siting, curtailment, and load co-location decide what the capacity is worth. The pattern is directly relevant to grid planning and large-scale renewable deployment elsewhere.